Constructing a VES diagram (H7) - Type 3
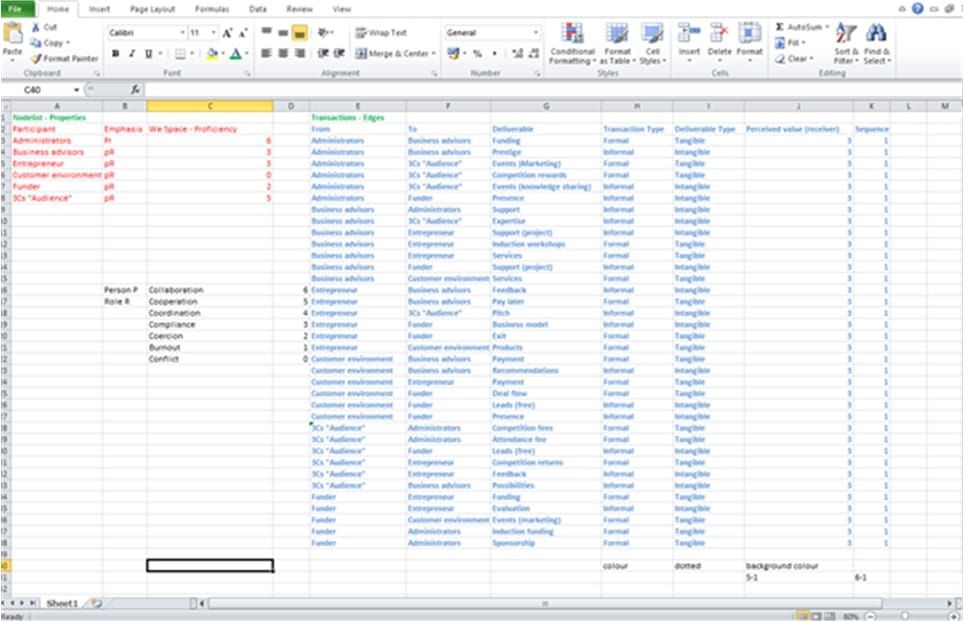
It can be useful to create a VES diagram from data. This note outlines how data contained in an Excel spreadsheet can be used as input to the free diagramming tool yEd to create a VES diagram.
yEd is a tool that offers powerful features that can be supplemented by software programers if needed. Extensive “Help” facilities are provided and a community of users and experts is responsive in resolving queries posed. Online video recordings by users are also available. All of these avenues of assistance have been used to create a VES diagram using yEd from data input from a spreadsheet.
yEd is a graph editor that comes for free for anyone who adheres to the yEd Software License Agreement. E.g. you are not allowed to distribute yEd on your own or use it in an automated process. Hence, the casual user may find it daunting until practice makes perfect. In 2021, I mapped out the structure using MindManager. In order to read the notes that have been added within the map, let me know, and I will forward the mmp Mind Manager file.
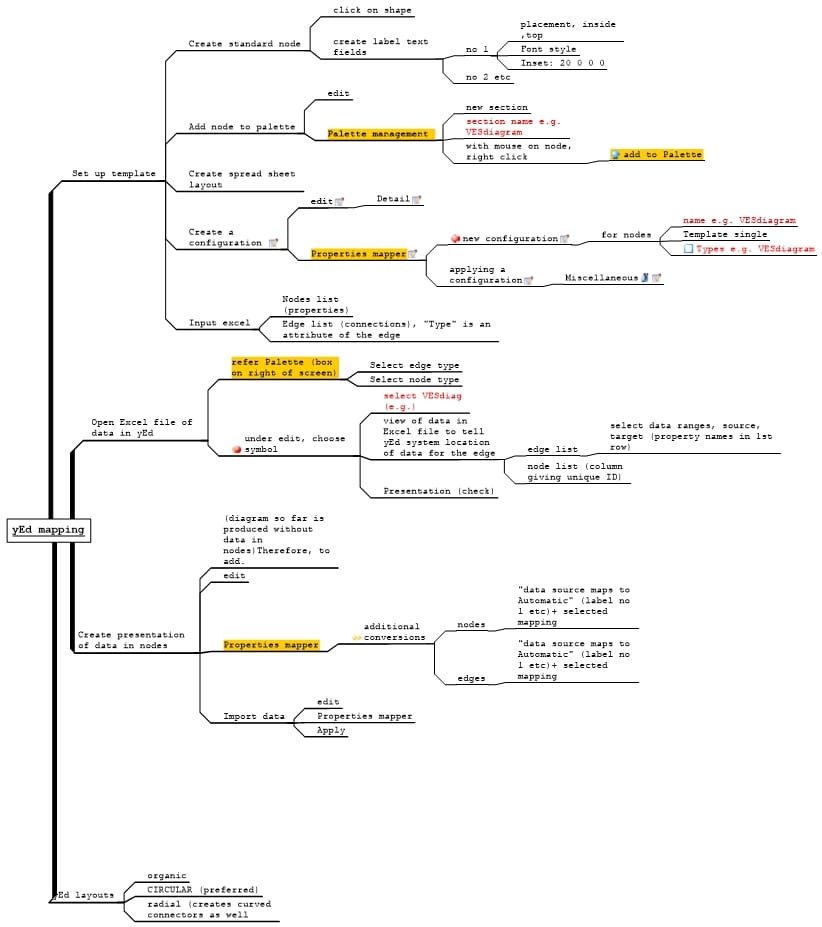
A comprehensive Note on using yEd to create the map below is available here.
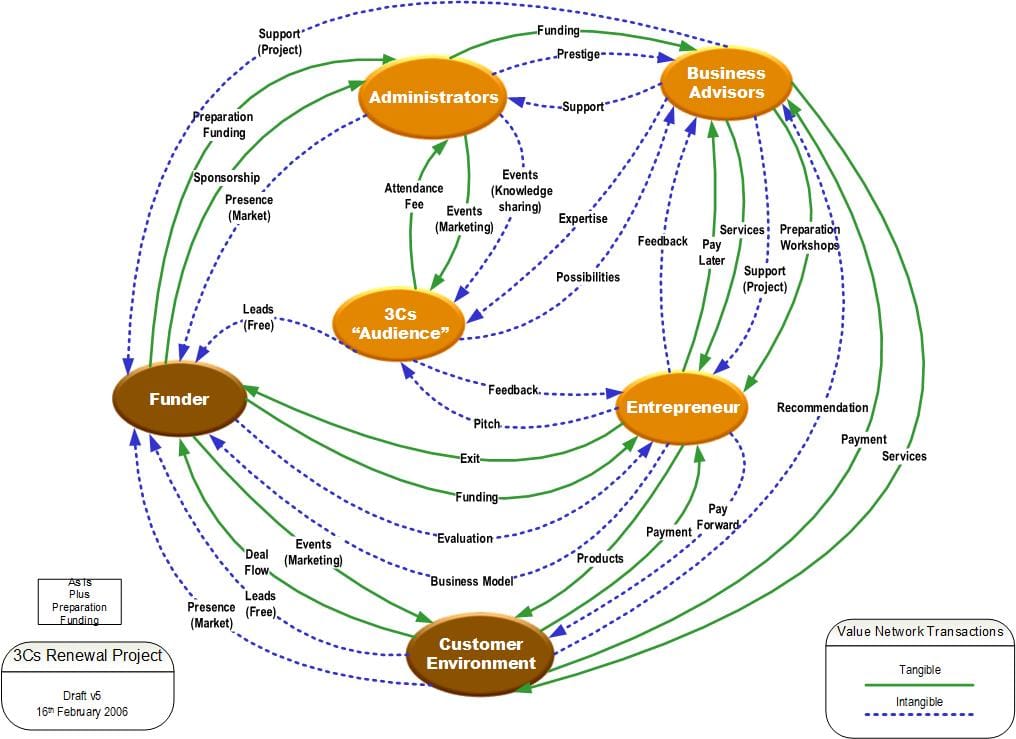
To justify the effort in doing this, the next step is to add "properties" of interest - issues that need to be analysed and discussed. For example, there may be concern about the type of interrelationships between people, or some measure of "diversity" needs to be made tangible. The business model below has been used to illustrate this potential and described in the above Note.